Transportation Pre-Assignment
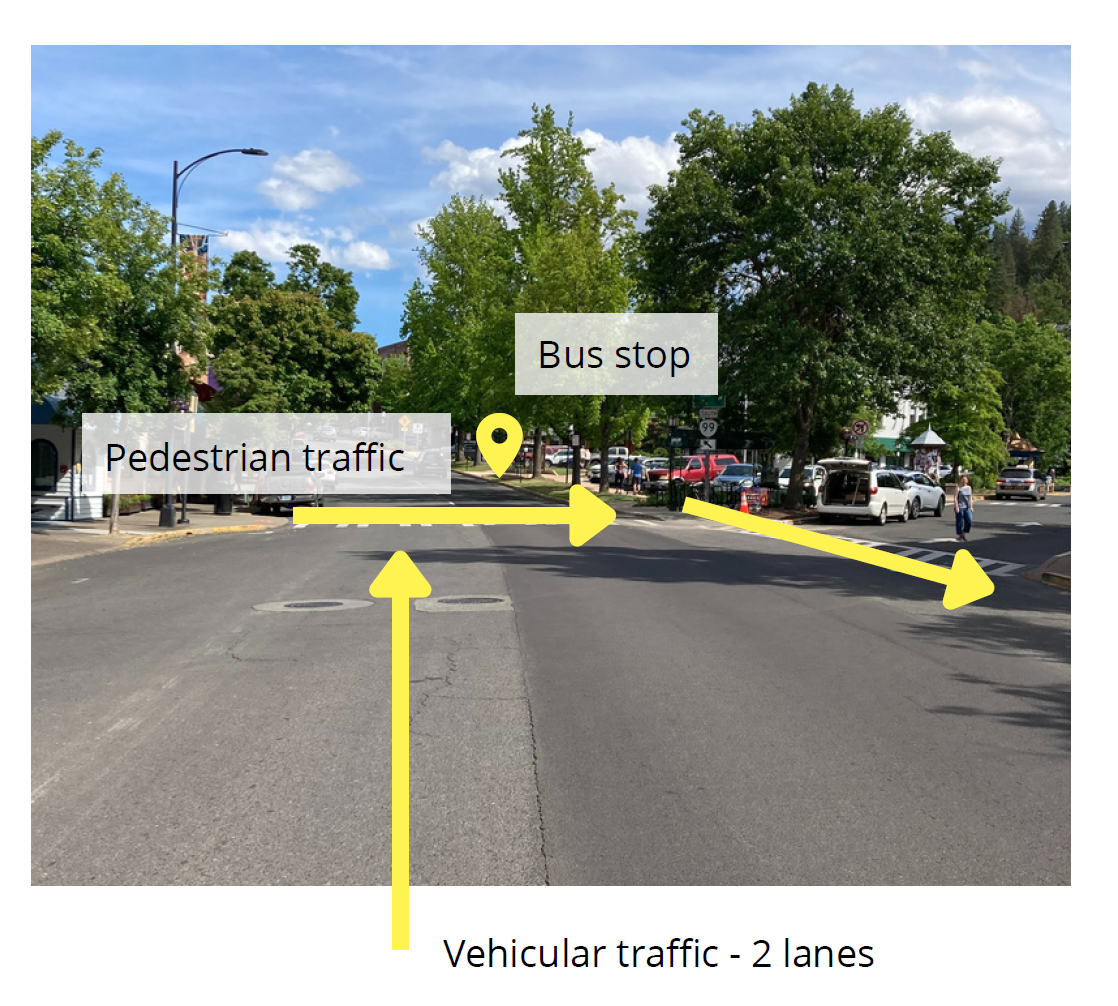
I chose to do the transit patterns observation for my pre-assignment. I sat on the corner of a 5-way intersection of E. Main St in Ashland, OR. Ashland is a tourism based town with access to mountain biking, hiking, and theater. The downtown area is highly developed and active, offering a variety of shops, dining, and green space. I observed the traffic patterns on Thursday, June 6th from 2:45-4:15pm. The weather was sunny and 85 degrees. I tracked the number of cars arriving from the north end of town and the pedestrians using the adjacent crosswalk (See Image 1).
Image 1: Observational Location
E. Main St. is the primary arterial road through town and an alternative to I-5. I picked the location because I knew it would be busy and capture tourist and residential traffic. The speed limit is 25mph but it seemed that many cars were going faster - it was hard to keep up with the counts! For the most part, traffic remained steady over the 90 minutes. With each 15 minute interval there was a slight increase in traffic and I estimate this would continue as it got closer to 5pm. The most popular form of travel was 4-person vehicles with a count of 932. When I started the assignment I brushed off 2-person vehicles, thinking that they werent common. But, they were the second most popular form of travel with 105 cars. The bus appeared 5 times, coming at roughly 18 minute intervals. More people were on the bus as it got closer to 5pm. It was unfortunate to see the bus almost empty in the beginning counts. With such a strong tourism draw, I think Ashland should be leveraging the bus more. I've taken the bus before and it makes multiple stops all throughout town. I was most curious in seeing the number of bicyclists, which amounted to 23. E. Main St. is two lanes with the right lane having the painted bicycle symbol. Personally, it's not a great place to bike because of the traffic volume and speed. There's not really a shoulder either, making it more uncomfortable to bike. Ashland considers themselves to be very sustainable and forward-thinking, making this a good opportunity to think more about how they could increase bicycle traffic downtown. In total, 1,148 vehicles passed by in 90 minutes.
Image 2: Total Number of Units Over 90 Minutes
Lastly, I wasn't surprised with the vacancy rates. 4 person vehicles were 67% vacant. Most cars that passed had 1 or 2 people. If I saw 3 or 4 people, it either appeared as a family with children or a group of friends. I was most surprised with the vacancy rate of 2 person vehicles at 44%. I was least surprised that minivans had the highest vacancy at 81%.
Image 3: Vehicle Vacancy Rate by Type


Comments
Post a Comment